Placer County Market Update – June 2018
#TuesdayTrend
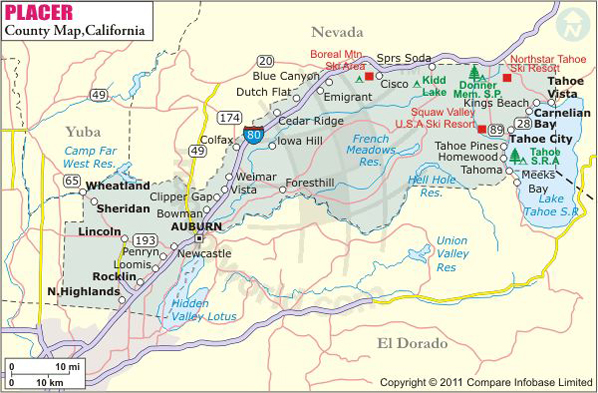
Placer County Market Update
The market held pretty steady in Placer County last month. We saw a slight increase in inventory with an even more subtle decrease in the number of homes closed. That being said, the number of homes put into contract changed by less than 1%. The price per square foot decreased ever so slightly, but not enough that it can’t bounce back in July.
Take a look at the information below to get the inside scoop! All of these figures and images come directly from MLS and offer a comparison to what the market looked like this time last year.
June 2018 is a Seller’s market*
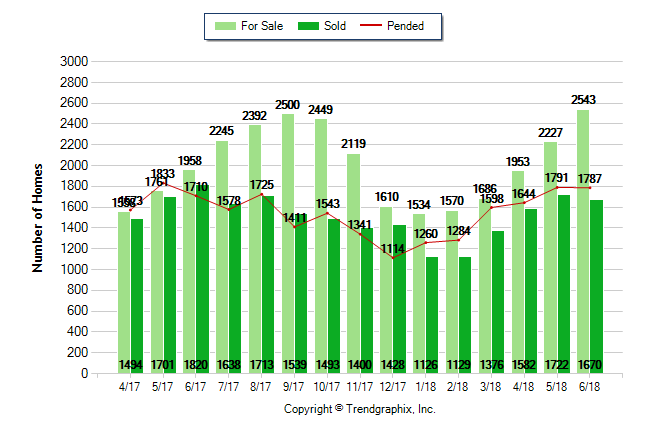
Home For Sale in June 2018: 2543 units.
| • | Up 14.2% compared to last month |
| • | Up 29.9% compared to last year |
Home Closed in June 2018: 1670 units.
| • | Down 3% compared to last month |
| • | Down 8.2% compared to last year |
Home Placed under Contract in June 2018: 1787 units.
| • | Down 0.2% compared to last month |
| • | Up 4.5% compared to last year |
June 2018 Average Sold Price per Square Footage is Neutral*
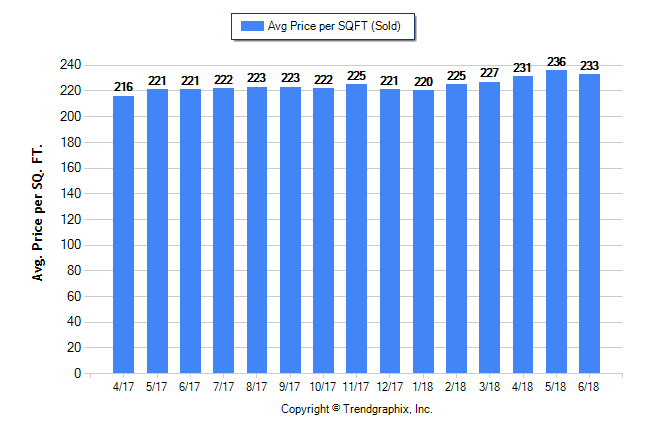
Average Sold Price per Square Footage in June 2018: $233
| • | Down 1.3% compared to last month |
| • | Up 5.4% compared to last year |
June 2018 Average Continuous Days on Market trend Remains Steady*
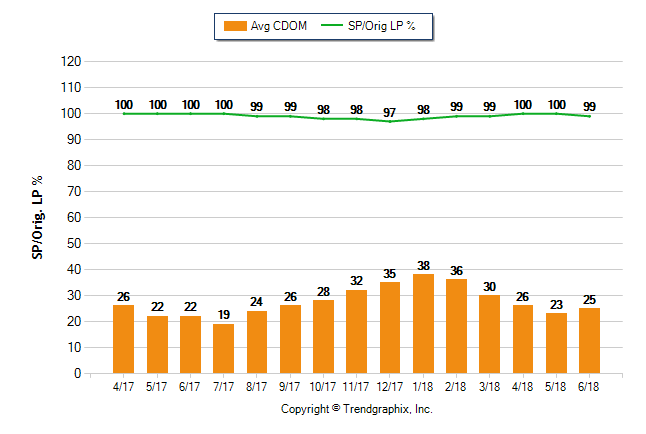
Continuous Days on Market in June 2018: 25
| • | Up 8.7% compared to last month |
| • | Up 13.6% compared to last year |
June 2018 Sold/Original List Price Ratio Remains Steady*
Sold/Original List Price % in June 2018: 99%
| • | Down 1% compared to last month |
| • | Down 1% compared to last year |
June 2018 Average For Sale Price is Neutral*
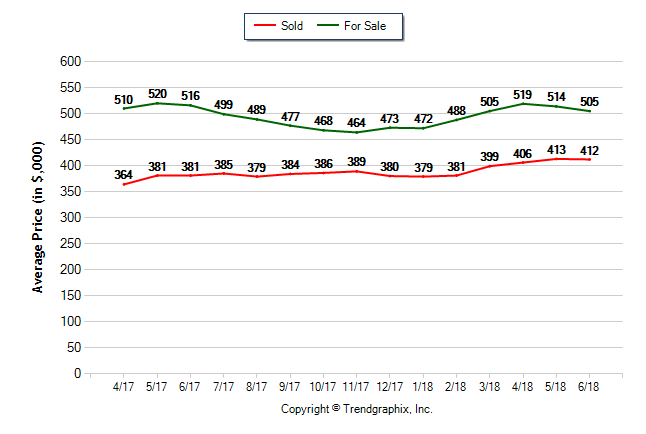
Average For Sale Price (in thousand) in June 2018: $505
| • | Down 1.8% compared to last month |
| • | Down 2.1% compared to last year |
June 2018 Average Sold Price is Neutral*
Average Sold Price (in thousand) in June 2018: $412
| • | Down 0.2% compared to last month |
| • | Up 8.1% compared to last year |
June 2018 is a Seller’s market*
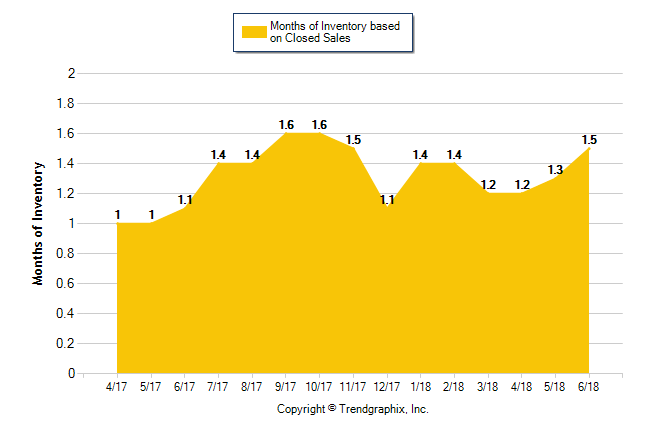
Months of Inventory based on Closed Sales in June 2018: 1.5
| • | Up 15.5% compared to last month |
| • | Up 37.2% compared to last year |